Below are technical set-ups that I have on watch for the next few days. The dollar will be important this week with lots of economic data on schedule (FOMC Statement, GDP, Non-farm Jobs) as it looks to make an inverse H&S in the 81.20-.50 range with the 200day as strong support. International markets will also be front and centre with Spanish flash GDP coming up overnight tonight (Monday) and PMI readings coming from various countries throughout the week. The jobs numbers and unemployment rate will be important as the market attempts to speculate FED tapering time. I wonder if we are near an inflection point with sentiment towards economic data, i.e. bad being good and good being bad.
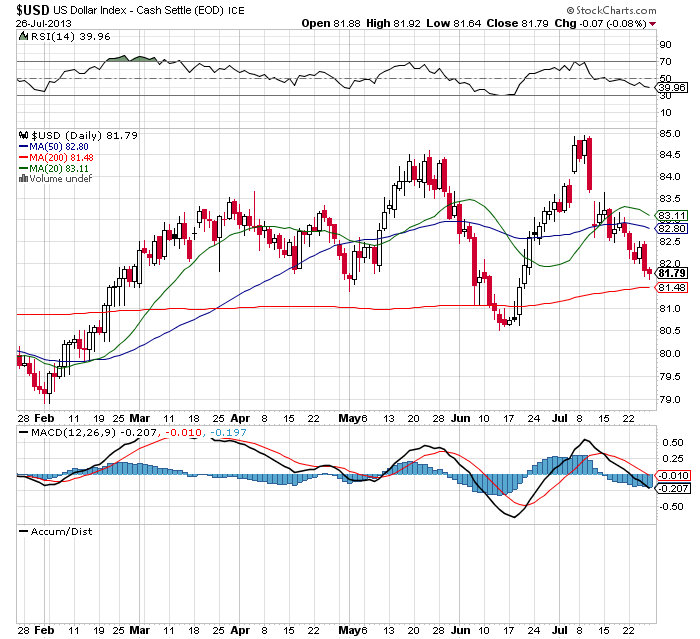 The almighty dollar setting up an Inverse Head & Shoulder pattern. MACD looks to be rounding with RSI. golden cross seems to have almost no effect with all eyes likely looking towards the 200SMA
The general market continues the path of least resistance with a terrific reversal throughout July. It has been eerily quite in the last few weeks and I would expect a sharp pull back to test the 20SMA in short order as traders continue to step in buying the 50&200SMA respectively. Overnight Sunday Asia-Pacific pulled back with the Nikkei leading the way to the downside and natural gas futures notably weak, off over 2% in early trading. 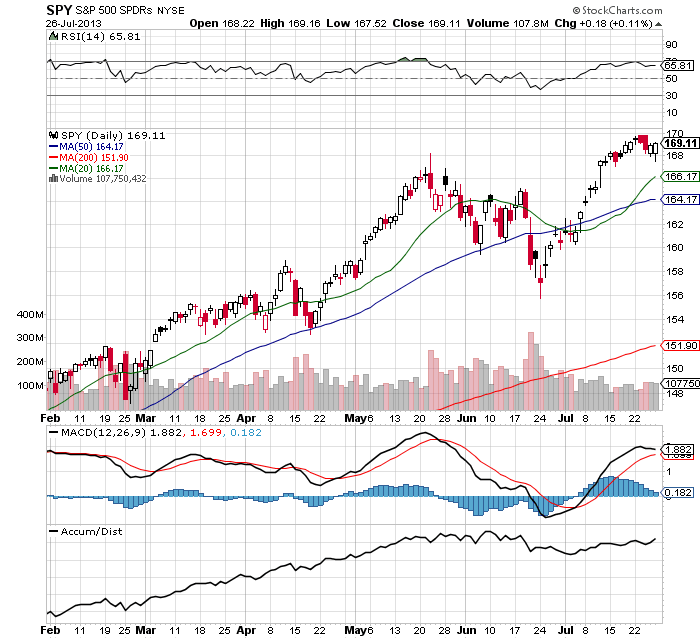
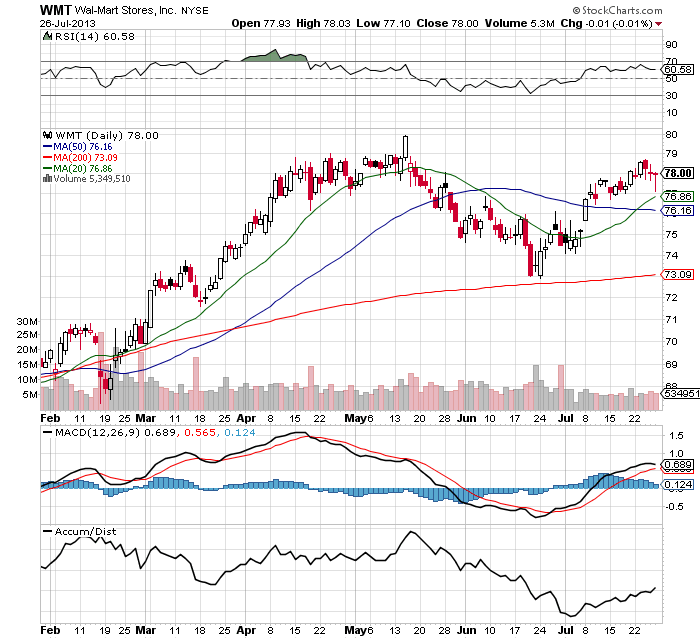
Will we see a pre E/R run up to new highs? Earnings are in two weeks, scheduled for August 15th, with the Aug. 80 calls looking attractive for a swing under 0.35 debit. Support at the 20SMA with traders Friday front running it, with lows of the day about a quarter higher.
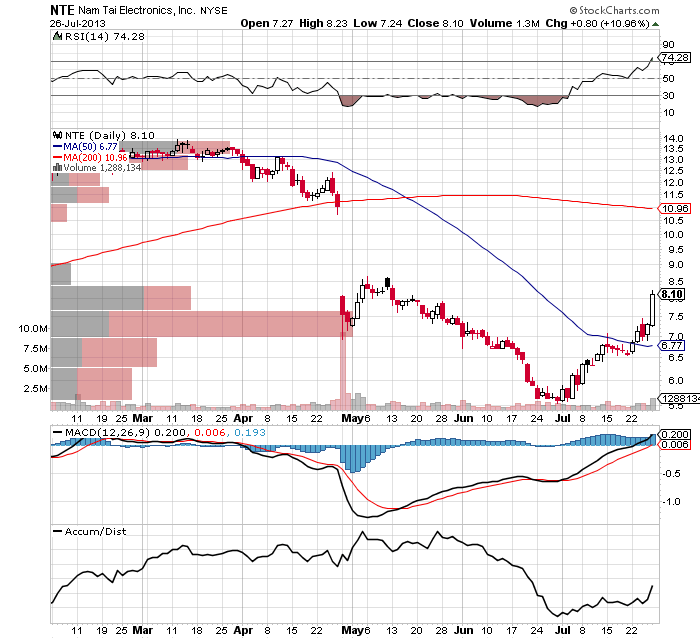
Nam Tai Electronics looks like it is getting a little over bought (that doesn’t stop price action) with RSI breaching higher to an area last seen in February. Will look for confirmation to take a line short in the 8.45-8.85 area. Over 8.90 close is bullish.
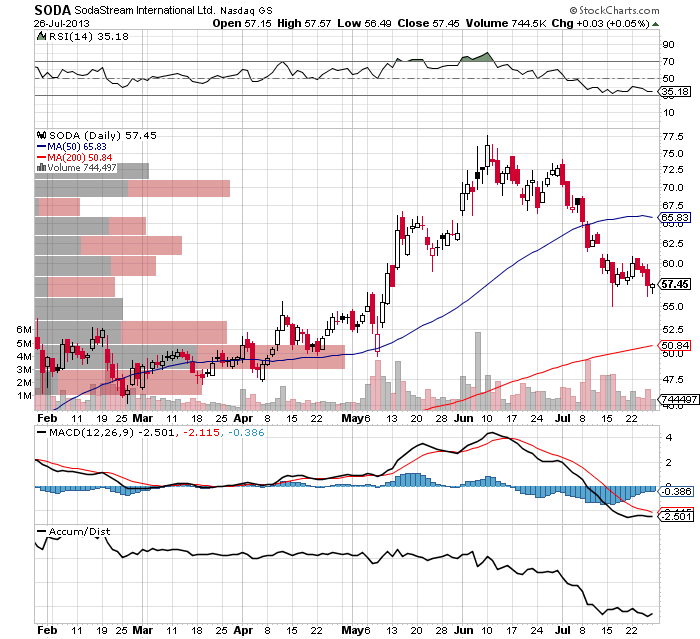
After the recent pullback SodaStream looks to be putting in a bottom with MACD & RSI both rounding. (or potentially a bear flag) Earnings are scheduled this week for Wednesday with analysts expecting 0.57 EPS from 0.45 a year ago. Nice support in the 50.50-55.00 zone.
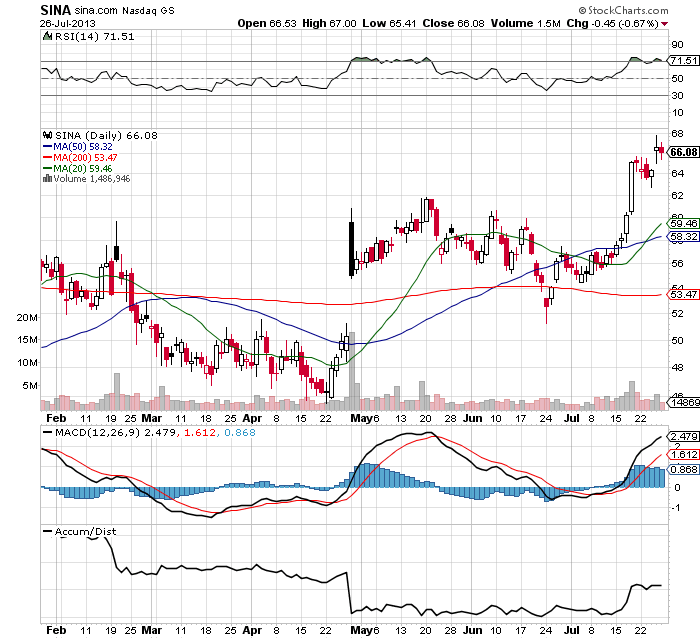
 Sina.com has been strong like most social media companies recently (FB, LNKD, BIDU, QIHU) and looks to be starting a rising channel coming out of a multiple bottom over the last year and a half. Have it on watch to see how the market acts at the 10&20SMA possibly starting a small position. Earnings are Aug. 12th while Baidu increased Q3 guidance after delivering a strong earnings report the last week.
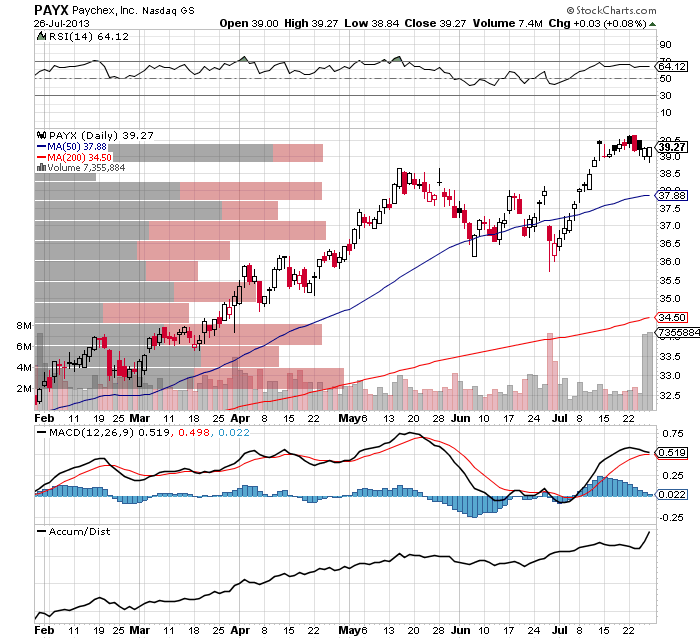
 Paychex looks ready to explode higher after large volume and institutional accumulation over the last week. Although the MACD does look to be fizzing out, (or consolidation) the prior high made in May will be support to buy as well as the 50SMA. All time highs in at 43.50s.
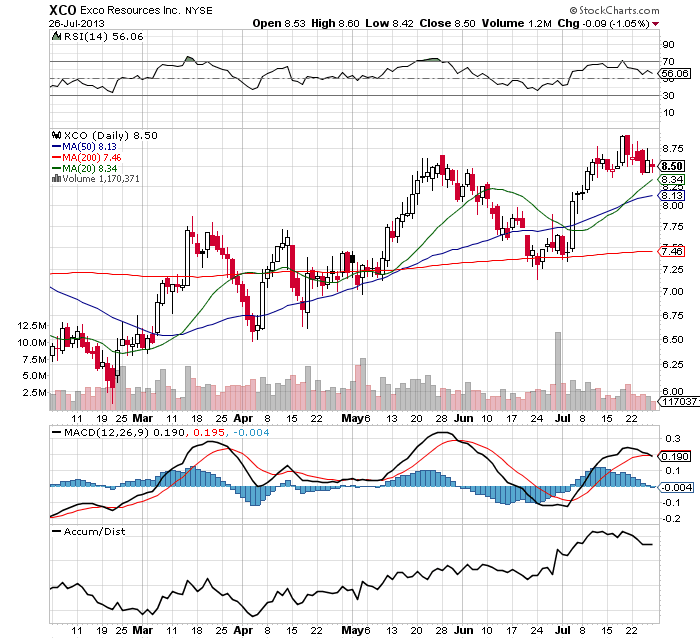
Natural gas has been incredibly strong since bottoming at around $2. I believe we are in the middle of a correction towards $3 and am seeing negative divergence in the MACD as well as RSI. Fundamentally there is value so I will not be one to short Exco Resources but simply look to enter lower because of growth prospects in the Marcellus shale. The 200SMA is a great place to look at stepping into a starter position.
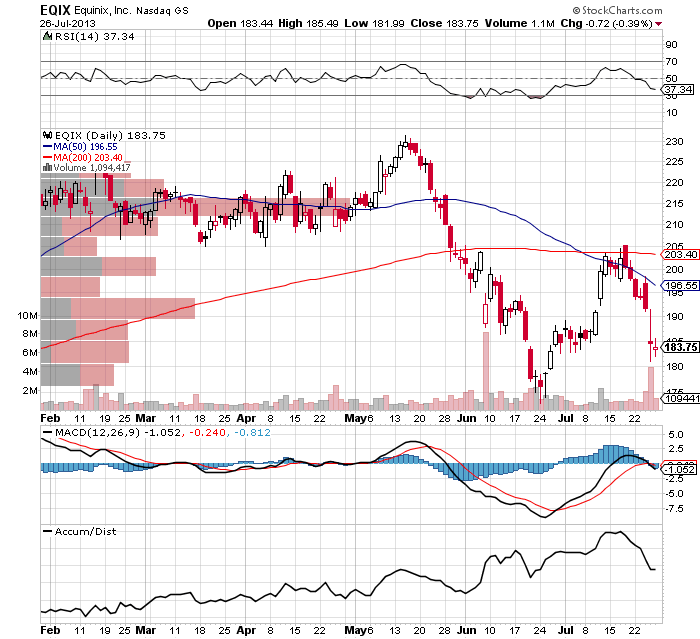
Is Equinix a broken down pony post E/R or buying opportunity? The 200SMA acted as strong resistance with 50SMA providing a down trend and MACD signalling a cross this could be a short to keep on the radar. 12% YOY Rev Growth for Q2 2013. They had 9% income from operations growth from Q2 2012. Equinix has a 8.8B MKT cap @ 180 on 49.4 shares and 1.8B 2012 Revs w/ management targeting 13% YOY growth in the 2nd half of 2013. The Multiple is 63x.
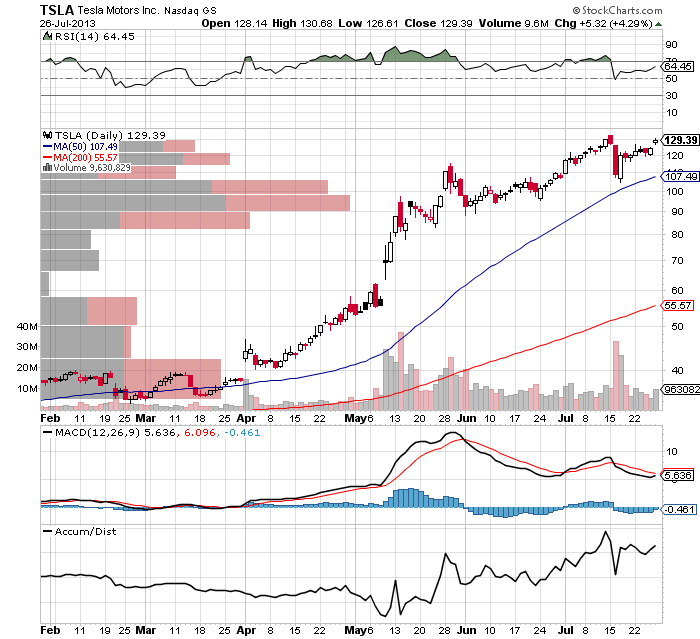
Long over 133.40 and short under 128. Some of the big institutions are surely playing games, notably DB and GS with price target wars. MACD and RSI are signalling a move higher although some divergence is occurring.
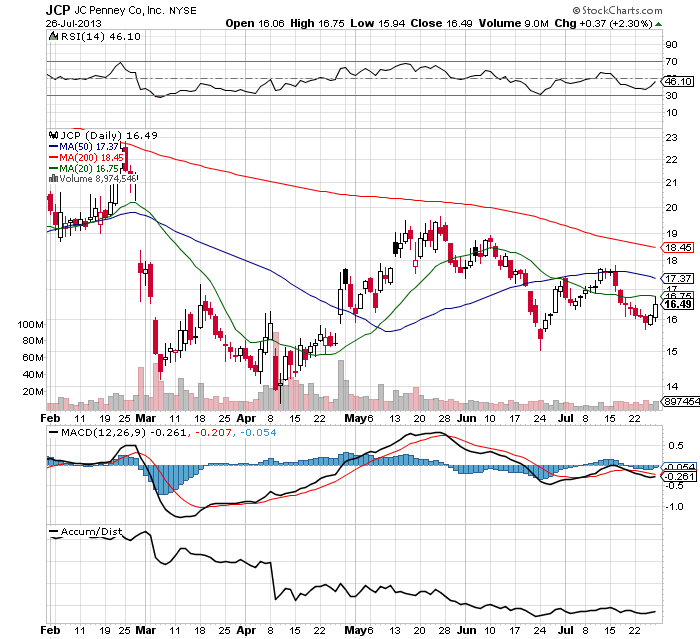
After Greenlight Capital disclosed they have covered their JCP short “The most profitable of 2012” it responded well with strong price action, ending the day up almost 3%. Intra-day the 20SMA acted as resistance finally closing on the 10SMA. The 200 day moving average is clear resistance at this point although MACD and RSI both acting strong, correlating with a double bottom.
Good luck & skill.


